Food recalls by year can be compared only after defining the agency, counting unit and date field. FDA product records, FDA firm-level recall events, USDA FSIS recalls and public health alerts are different measures. This guide presents a dated FDA enforcement snapshot and verified FSIS annual examples, then explains why their totals should remain separate. The research date is October 9, 2026; a 2026 calendar-year count is incomplete. Annual statistics describe recorded regulatory activity and do not determine whether the particular food in your kitchen is affected.
Choose what your annual recall count measures
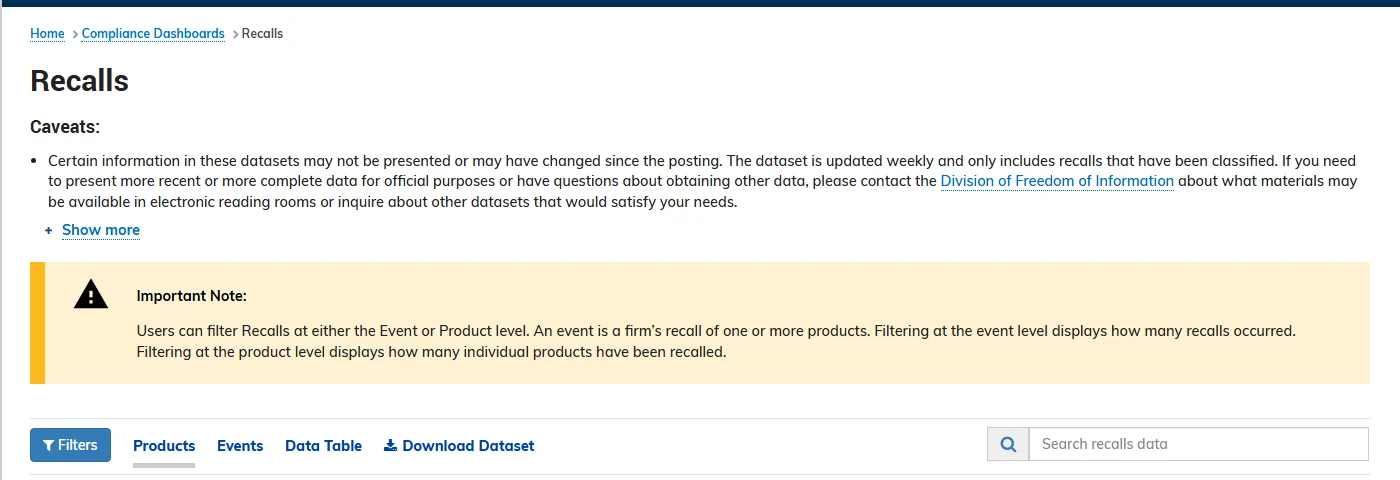
Start with a sentence that defines the series: which agency, which products, which unit and which date. Without those details, two accurate numbers can appear contradictory. The FDA recall dashboard explicitly distinguishes events from products. It defines an event as a firm's recall of one or more products. Selecting products therefore answers a different question from selecting events.
A useful annual table keeps the unit in the column heading. “FDA food enforcement product records” is more precise than “food recalls” when each row is a product-level record. An event total counts the distinct identifiers represented in that dataset. Neither total is automatically the number of contamination sources, outbreaks, affected stores or people who became sick.
Events, product records and public notices
Consider a hypothetical firm that recalls three packaged foods and later publishes an expansion. That situation can produce one firm-level event, several product records and more than one public announcement. Counting the announcements would measure communications; counting the product records would measure entries. This example explains the distinction and is not an observation about a particular year's data.
| Unit | What it measures | What it cannot establish alone |
|---|---|---|
| Firm-level event | A recall grouping for a recalling firm. | Distinct outbreaks or contamination sources. |
| Product record | A product-level enforcement entry. | Packages, servings or consumers exposed. |
| Public notice | A published announcement or update. | A complete enforcement inventory. |
| Public health alert | An agency alert, recorded separately from recalls. | An additional recall without checking its type. |
The FDA Enforcement Report explanation also distinguishes a firm's public warning from subsequent classification and reporting. A later enforcement posting should not automatically be interpreted as a new expansion of the public warning. For analysis, choose one source and one measure consistently; for a consumer decision, open the actual product notice and its updates.
USDA FSIS annual summaries show recalls and alerts separately
The FSIS annual summary collection organizes calendar-year recall activity by class, reason and product. Its public health alert summaries are separate. The following four-year comparison uses the agency's published totals, retaining the distinction between recalls, alerts and pounds.
| Calendar year | FSIS recalls | Public health alerts | Pounds recalled |
|---|---|---|---|
| 2022 | 45 | 23 | 1,769,556 |
| 2023 | 65 | 24 | 4,005,384 |
| 2024 | 34 | 19 | 19,913,171 |
| 2025 | 42 | 24 | 71,420,721 |
The figures come from the official 2022 summary, updated March 22, 2023; 2023 summary, updated February 28, 2024; 2024 summary, updated December 17, 2025; and 2025 summary, updated February 18, 2026.
Recalls rose by 20 from 2022 to 2023, an increase of approximately 44.4% relative to 45. They then fell from 65 to 34 and rose to 42 in 2025. The last change is eight additional recalls, or approximately 23.5% relative to 34. This sequence does not show a steady increase every year. Public health alerts have their own sequence; adding them to recalls and relabeling the sum would change the measure.
The pounds column also moves differently from the recall count. That matters when a headline says recalls became “larger”: it may mean greater quantity, more affected products or more events. State the intended meaning. These totals describe reported FSIS activity and quantity; they do not supply the number of servings consumed or a foodborne-illness rate. Extending the series requires the same official columns and calendar-year basis, with any revisions retained. If an older summary lacks an alert count, do not silently treat that missing value as zero.
A dated FDA food enforcement snapshot by year
The following figures are calculations from the official openFDA food enforcement endpoint, retrieved October 9, 2026. The response metadata identified the dataset's last update as September 30, 2026. Completed years use recall initiation dates January 1 through December 31. The final row uses January 1 through October 9, 2026 and is partial, including the source's reporting lag.
| Initiation calendar year | Distinct event IDs | Product records |
|---|---|---|
| 2020 | 381 | 1,117 |
| 2021 | 463 | 1,501 |
| 2022 | 452 | 1,427 |
| 2023 | 478 | 2,221 |
| 2024 | 482 | 1,387 |
| 2025 | 569 | 1,571 |
| 2026, partial snapshot | 311 | 885 |
These are dated endpoint calculations, not a separately published FDA annual statistical table. They should not be added to the FSIS totals above as though every column measured the same thing. The two FDA columns also move differently: 2023 has substantially more product records than 2024, while the event-ID count is slightly lower. That illustrates why choosing the counting unit can change the apparent trend.
How these event and product counts were calculated
The queries filtered recall_initiation_date to each year's range, then requested counts grouped by event_id. The number of returned identifier groups supplies the event-ID column. Adding the record counts in those groups supplies the product-record column. For each year, that sum was checked against the endpoint's independently returned total number of matching records.
The official query documentation explains the search and count parameters. Each annual response returned fewer than the requested maximum of 1,000 identifier groups, and its grouped sum matched the record total. This matters because an incomplete list of groups would undercount events. An example 2025 query shows the selected field and range. Later reruns may change as source records are revised.
What the food endpoint includes
The endpoint documentation describes weekly public food enforcement records from FDA's Recall Enterprise System. This series applies no human-food-only filter: the endpoint also contains pet-food records, including a verified refrigerated dog-food example. It should therefore be labeled by endpoint scope, rather than presented as a count exclusively of human-food notices.
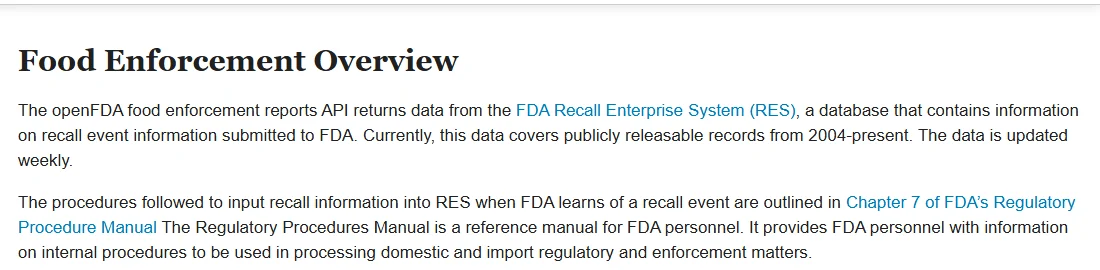
No status filter was used. These statistics describe represented records, not a live inventory of currently open recalls. The documentation specifically cautions against using this dataset to track a recall's lifecycle or issue consumer alerts. Use the current official announcement for the affected product and its instructions.
Keep calendar years separate from fiscal years
The FSIS annual summaries above use calendar years. The derived FDA table also uses calendar years, selected by initiation date. By contrast, the FDA dashboard labels its annual graphs by fiscal year. Matching the printed year number is insufficient: the windows differ.
USAGov explains that the federal fiscal year runs from October 1 through September 30 of the following calendar year. Consequently, fiscal year 2026 covers October 1, 2025 through September 30, 2026. Calendar year 2026 covers January 1 through December 31, 2026. The final three months of calendar 2025 belong to fiscal 2026, while the final three months of calendar 2026 belong to fiscal 2027.
| Label | Date window | Position on October 9, 2026 |
|---|---|---|
| Calendar 2026 | January 1–December 31, 2026 | Year still incomplete. |
| Federal fiscal 2026 | October 1, 2025–September 30, 2026 | Period ended; records may still lag. |
| Article's 2026 query | Initiation dates January 1–October 9, 2026 | Partial snapshot with September 30 dataset update. |
Also specify the trigger date. The openFDA field reference lists initiation, report and classification dates separately. A recall initiated late in one year can be reported or classified later. A count grouped by one of those fields can legitimately place it in a different year from a count grouped by another. This article does not substitute the dashboard's fiscal graph values for its initiation-year calculations.
When comparing an external chart, read its notes before calculating a percentage change. Write down its year convention, selected date field and unit. If those details are missing, describe the chart as insufficiently specified rather than forcing it into the same series. Preserving that distinction prevents an apparent annual jump that is actually a change in the counting window.
Recall reasons and classifications change the comparison
An annual total combines different reasons for action. The FSIS 2025 summary lists 13 recalls for extraneous material, nine for undeclared allergens and four for Listeria monocytogenes, among other reasons. Describing all 42 as bacterial contamination recalls would misstate the table. For a cause-specific trend, compare the same reason category across years and retain any changes in the agency's labels.
The FDA classification definitions describe hazard assessments. Class I concerns a reasonable probability of serious adverse consequences or death; Class II covers temporary or medically reversible consequences, or a remote probability of serious consequences; Class III concerns situations not likely to cause adverse health consequences. The class is not a count of packages or a report of how many people became ill.
Keep those dimensions separate. A year can have fewer recall events but a different mix of classes or reasons. To evaluate that mix, retain the denominator: a reason count divided by all recalls measures its share of recorded recalls, not a person's chance of encountering contaminated food. The summaries do not provide a denominator of all food produced or consumed.
Counts and pounds answer different questions
The FSIS 2025 reason table assigns 69,619,536 pounds to the 13 extraneous-material recalls, compared with 71,420,721 pounds across all 42 recalls. This category therefore accounts for most of the published quantity while representing fewer than half of the recalls. A quantity trend and an event trend can tell different stories.
Do not convert pounds into illnesses or servings without additional data. Likewise, avoid adding FDA quantity strings expressed in cases, units or undetermined amounts as though they shared a weight unit. A defensible comparison states which quantities are known, uses compatible units and preserves unknown values. The annual event count remains useful, but it answers a narrower question than the physical scale or health consequences of the affected food.
Why 2026 needs a partial-year label
The 2026 FDA row is limited in two ways. Its selected initiation-date window ends October 9, before the calendar year ends. Its underlying dataset was last updated September 30, so extending the query through October 9 does not make the source current through that date. A query cutoff and a dataset update date describe different parts of the observation.
Consequently, 311 represented event IDs and 885 product records cannot be compared with the completed 2025 row to conclude that the full-year total fell. Months remain outside the calendar window, and some recently initiated recalls may not yet appear in the available snapshot. The FDA enforcement explanation notes that firm warnings can precede classification and reporting. Waiting for a statistical dataset is not the appropriate way to assess a newly announced product warning.
For a year-to-date comparison, select the same initiation-date cutoff in each year and retain the snapshot dates. Label that result as a comparison of represented records through the chosen cutoff. Even then, newer records may have had less time to be reported or revised. A same-date filter improves the window match; it does not remove every reporting difference.
Avoid a straight-line projection that multiplies the partial count into a full-year prediction without explaining assumptions. Such a projection would assume a pace that this table has not established. It could also hide a later expansion, a batch of delayed records or a change in the source's coverage. This article makes no full-year 2026 forecast.
When quoting the partial row, keep the qualification in the same sentence as the figure. “A September 30 dataset retrieved October 9 contained 311 event IDs with 2026 initiation dates in the selected range” preserves the evidence. Calling that figure “all 2026 food recalls” removes the observation limits and changes the claim. For live consumer information, follow the agency's current announcements rather than this historical statistical snapshot.
Use annual trends to find the right product record
An annual series can help you choose an archive, but the package decision comes from the individual notice. Search the brand, full food name and recalling company, then compare the announcement's scope with the product. The FDA consumer guide explains the identifiers to look for, including package size, UPC, lot codes, printed dates and distribution. A lower annual total does not place a matching package outside a recall.
Keep the package's use-by year separate from the recall year. Food with a 2026 printed date could appear in a recall initiated in 2025. A notice published in January can concern an event initiated in December. If searching only one year produces no match, search adjacent years and the company name, then read the actual date fields. Avoid interpreting an empty year-filtered search as proof that the product was unaffected.
The FDA firm-issued recall datasets offer year-specific announcement downloads. Their purpose differs from the enforcement endpoint used for this article's calculations. They can help locate public notices, but counting their entries would create a different series. For FSIS-regulated food, use the agency's recall or alert record and its attached labels, rather than assuming the FDA archive contains every relevant notice.
Once the product details match, FoodSafety.gov advises against opening or consuming the food. Follow the specific return, disposal or other instructions in the notice. If a code is unreadable or the package has been discarded, preserve the available purchase details and ask the official contact about the missing identifier. Do not infer a universal refund from an annual statistic.
Product Recall Checker is an independent website. Its latest listings and official food-source guide can help find a starting point. The issuing agency and company provide the scope and actions. Use annual numbers to understand a defined dataset; use the product record to decide what to do with a particular purchase.
Comments
Comments are reviewed before publication. Do not post personal information, serial numbers, medical details, or emergency reports. For urgent safety concerns, use the official agency contact in the recall notice.
Sign in with Google to leave a comment
Loading comments...